Mara Schmidt · 6 September 2026
Charting New Paths in Digital Note-Taking with Integrated Forest Visualization Features
Digital note-taking has evolved beyond simple text entry into systems that incorporate visual elements designed to represent information hierarchies adn growth patterns, and forest visualization stands out as one approach where notes transform into tree structures that expand based on content depth and user interactions. Researchers at various institutions have documented how such features allow users to see relationships between ideas through branching canopies and root networks that mirror thematic connections within their notes. Data from educational technology reports indicate rising adoption rates among students and professionals who manage complex projects requiring layered information.
Core Mechanics Behind Forest Visualization in Note Applications
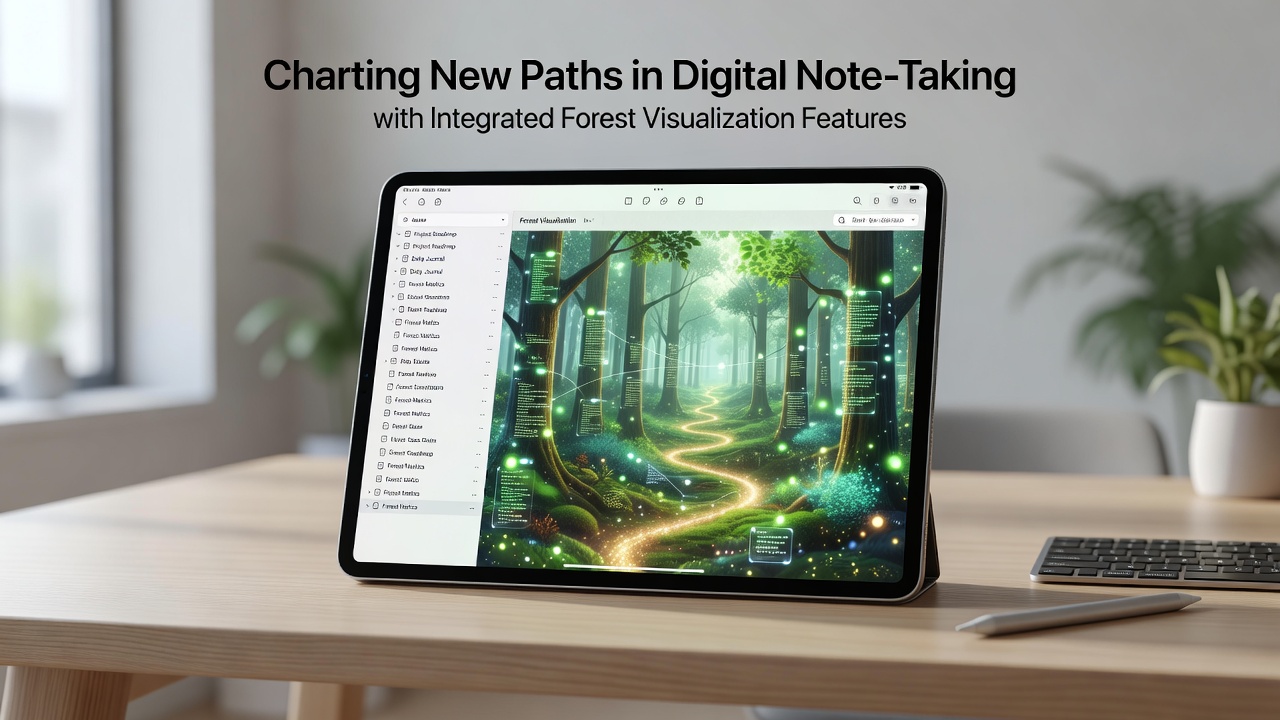
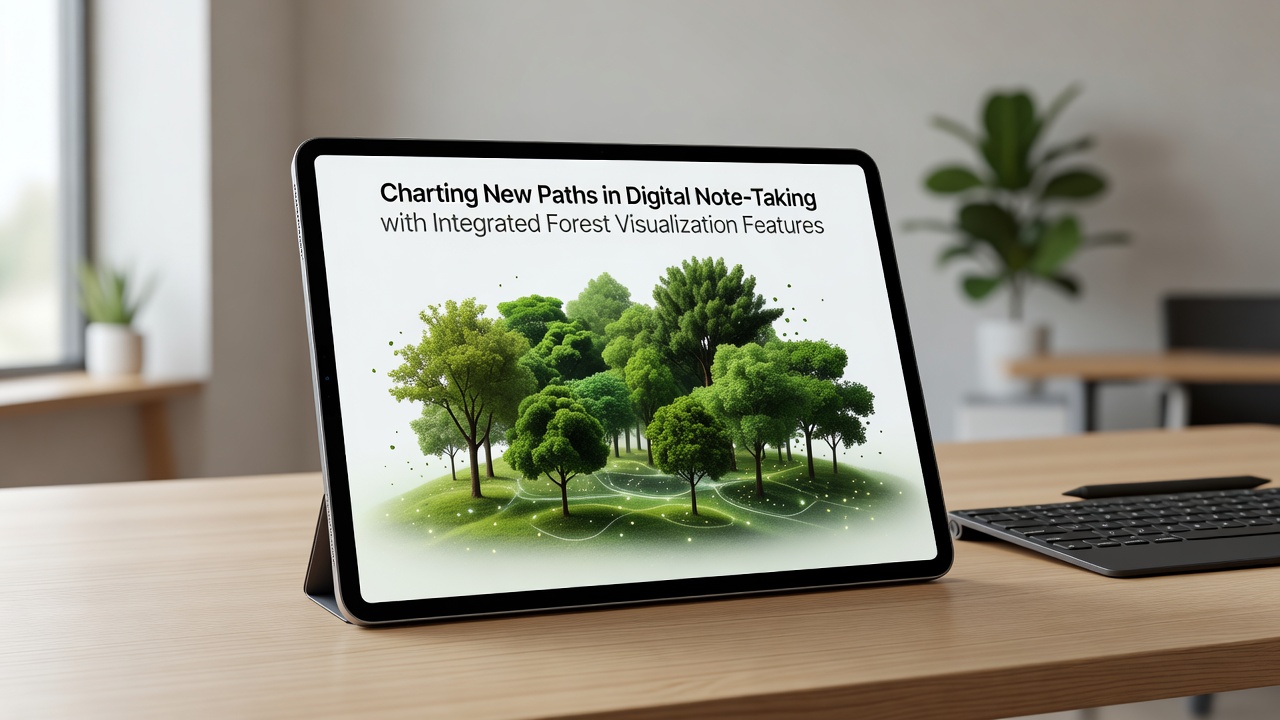
Forest visualization integrates algorithms that map note entries to ecological elements where individual entries become saplings and interconnected topics grow into larger trees while temporal data influences seasonal changes like leaf density or color shifts. Users input notes through standard interfaces yet the backend processes keywords, tags, and cross-references to generate these visual outputs automatically. Studies from academic sources show this method supports pattern recognition because visual density highlights areas of concentrated thought versus sparse regions needing expansion.
One implementation allows dragging notes to reposition trees within the forest layout, which then updates metadata links across the entire collection, and this dynamic adjustment helps maintain accuracy when information hierarchies shift over time. Observers note that color gradients often represent priority levels or completion status while path lines between trees illustrate sequential workflows or dependency chains. Those who have examined usage logs report that sessions involving forest views tend to last longer because the engaging layout encourages exploration of overlooked connections.
Integration with Existing Note-Taking Workflows
Modern platforms combine forest views with traditional lists, calendars, and search functions so that switching between modes happens seamlessly without data loss or reformatting. For instance, a user might start with bullet points on a research topic, then activate the forest mode to reveal how subtopics branch outward from a central trunk idea. This dual representation supports both linear review and holistic overviews depending on the task at hand.
Developers have incorporated export options that preserve the forest structure in PDF or interactive web formats, allowing sharing with collaborators who can navigate the visualization independently. Evidence from industry analyses suggests compatibility with cloud synchronization services ensures updates propagate across devices while maintaining visual consistency. What's interesting is how some systems now tie forest growth metrics to productivity trackers, displaying canopy coverage percentages that reflect completed versus pending note clusters.
Data Insights and Adoption Trends Through 2026
Figures from technology adoption surveys reveal steady increases in visualization tool usage within knowledge work sectors, and projections point toward further integration by September 2026 when several platforms plan feature expansions tied to collaborative editing in shared forests. A report by the OECD highlights how visual aids in digital environments correlate with improved information retention across different age groups and learning styles. Meanwhile, research from Canadian institutions has tracked similar patterns in professional settings where teams use these tools for project documentation.
Algorithms continue to refine based on user feedback loops, incorporating machine learning to suggest new branches when note clusters reach certain thresholds of similarity. This adaptive quality means forests evolve alongside the user's thinking process rather than remaining static snapshots. Those who've analyzed long-term usage data find that participants often return to review older forests to observe how initial ideas matured into complex structures over months or years.
Technical Considerations for Developers and Users
Building robust forest visualization requires balancing computational efficiency with graphical detail because rendering large note collections demands optimized tree generation code that avoids lag during real-time edits. Developers frequently rely on graph theory principles to calculate node positions and connection strengths while ensuring accessibility features like screen reader compatibility describe visual elements through structured text alternatives. Users benefit from customization sliders that control density levels or animation speeds to match personal preferences and device capabilities.
Security protocols play a role since shared forests involve permissions that limit who can alter specific branches or view root-level metadata. Industry standards from organizations focused on data privacy help guide these implementations across regions. And yet the core appeal remains the intuitive mapping of abstract information onto familiar natural forms that reduce cognitive load during review sessions.
Conclusion
Forest visualization features continue to shape digital note-taking by providing spatial representations that complement textual content and foster deeper engagement with accumulated knowledge. As platforms prepare updates scheduled around September 2026, integration with emerging collaboration standards promises broader accessibility. The approach draws from established research on visual learning while adapting to practical workflow demands across educational and professional contexts.